

MR Spectroscopy
Quick links
More details:Dr. Chris Hanstock
Collaborators and projects:
Dr. Nick Coupland - Depression and anxiety
Dr. Sanjay Kalra - ALS
Dr. Wayne Martin - Parkinson's disease
Systems used:
1.5T, 3T, 4.7T
MR Spectroscopy (MRS)
 The MRS information is gathered in a similar fashion as for MRI.
However, rather than providing a spatial map or image, MRS results in a frequency spectrum containing discrete signals
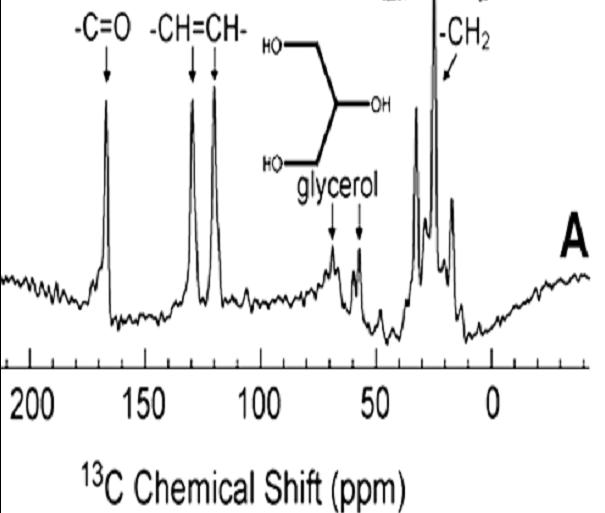
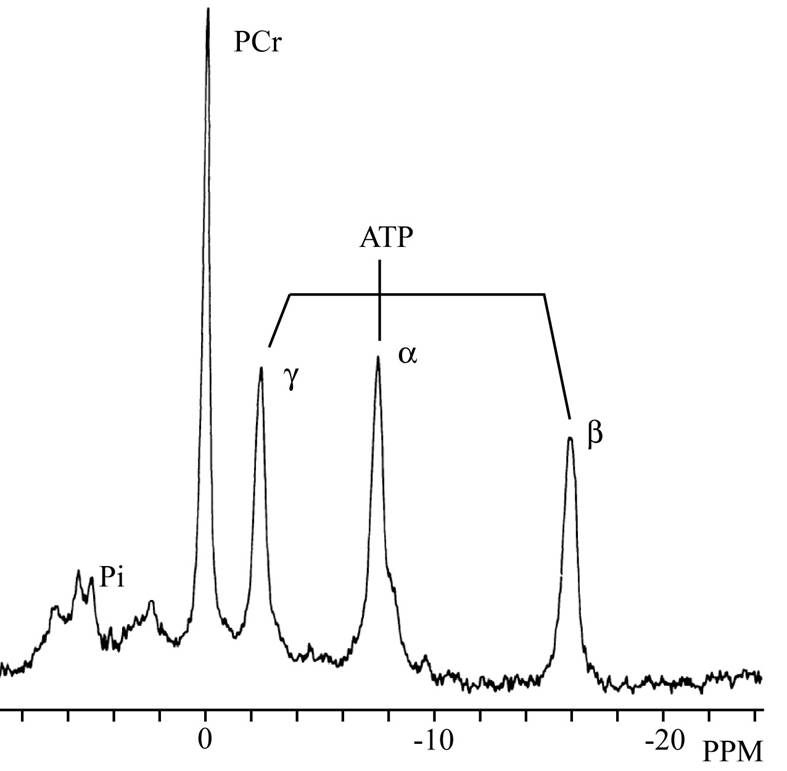
from a selected resonating nucleus. The nuclei most commonly studied by in vivo MRS include 1H, 13C (see example below), 19F, 23Na, and 31P (see example below).
Due to the high natural abundance of 1H, and its ubiquity in all in vivo metabolites,
it has been the focus of many MRS studies. The magnitude of a metabolite peak in the frequency spectrum,
is proportional to its concentration in the volume of tissue being examined. Measuring changes in these peak areas,
which result from either normal function, or disease or from the effects of drugs, allow us to monitor intracellular
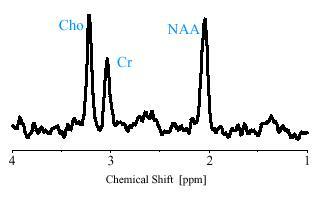
changes which are not always accompanied by structural changes. The 1H spectrum, illustrated to the left,
was obtained from the brain stem of a patient with amyotrophic lateral sclerosis (ALS),
a rapidly progressing neuro-degenerative disease. Of the 3 peaks in this spectrum,
it is that from N-acetylaspartate (NAA) which is important in the study of ALS since it is only found in neurons.
Its measurement therefore allows us to estimate the neuronal content and to observe its
depletion as the disease progresses, and to evaluate the effectiveness of drug treatments in protecting neurons.
The MRS information is gathered in a similar fashion as for MRI.
However, rather than providing a spatial map or image, MRS results in a frequency spectrum containing discrete signals
from a selected resonating nucleus. The nuclei most commonly studied by in vivo MRS include 1H, 13C (see example below), 19F, 23Na, and 31P (see example below).
Due to the high natural abundance of 1H, and its ubiquity in all in vivo metabolites,
it has been the focus of many MRS studies. The magnitude of a metabolite peak in the frequency spectrum,
is proportional to its concentration in the volume of tissue being examined. Measuring changes in these peak areas,
which result from either normal function, or disease or from the effects of drugs, allow us to monitor intracellular
changes which are not always accompanied by structural changes. The 1H spectrum, illustrated to the left,
was obtained from the brain stem of a patient with amyotrophic lateral sclerosis (ALS),
a rapidly progressing neuro-degenerative disease. Of the 3 peaks in this spectrum,
it is that from N-acetylaspartate (NAA) which is important in the study of ALS since it is only found in neurons.
Its measurement therefore allows us to estimate the neuronal content and to observe its
depletion as the disease progresses, and to evaluate the effectiveness of drug treatments in protecting neurons.
Phosphorus spectroscopy: Carbon spectroscopy: